Learn how to set and manage baselines in Smartsheet to track project progress and variances. Discover how to track your project’s critical path to ensure timely completion.
Set baselines on a sheet
When you activate baselines, three non-editable columns appear on the sheet, in addition to your actual start date and end date columns:
- Baseline Start: The date in your start date column.
- Baseline Finish: The date in your end date column.
- Variance: The difference between the actual end date and baseline end date.
Brandfolder Image

Only sheet Owners or Admins can create and edit baselines. Anyone else who has been shared to the sheet can view baselines.
Keep in mind:
- You can only add one baseline to a project sheet. If multiple start date and end date columns exist, you can only associate one set of start date and end date columns with baselines.
- You can't add a baseline to a row without a start and end date or to a row with a start date after the end date. The cell data must also be in an acceptable date format. For example, TBD or July don't work.
- The activity log doesn’t track historical baseline modifications, but they can be found in the cell history.
- Baselines appear as read-only data in cells. Consequently, baselines are displayed in reports, dashboards, and other Smartsheet items, but you can’t modify them.
- You can convert the baseline columns to date (baseline start and baseline finish) and text/number (variance) columns, and the cell data remains unchanged.
Set up your sheet to use baselines
To enable baselines on your sheet:
- Add Start Date and End Date columns
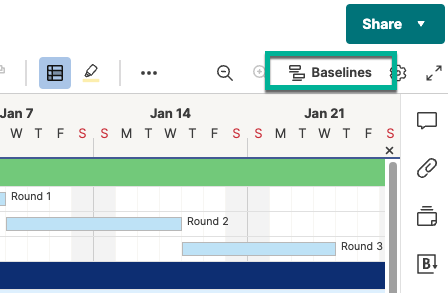
- Switch to Gantt View, then select the Baselines button in the toolbar. The baseline summary displays the actual and baseline start and end dates, as well as the variance.
- To activate, select the Set button.
Edit baselines in the baselines summary
Once enabled on your project sheet, you can use the baseline summary to view, edit, and remove baseline information.
To open the baseline summary, go to Gantt view, and select the Baselines
Brandfolder Image
![]() button in the toolbar.
button in the toolbar.
Brandfolder Image

Show baseline in Gantt
Toggle for enabling baseline in Gantt view.
You can see visual Gantt bars for baseline and actual dates. If you change your preferences to display or hide baseline bars in the Gantt view, the change appears for your user only and doesn't affect other users.
Although the Baseline Start, Baseline Finish, and Variance columns are visible in a report, baseline bars from the Gantt view don't show in either reports or dashboard widget reports. Additionally, baselines aren't displayed when you print your Gantt view.
Actual
The earliest actual start and the latest actual end date in your columns.
Baseline
The earliest baseline start date and latest baseline end date in your columns. These were established when you initially enabled the baseline and can’t be modified.
Variance
The difference between the actual and baseline end dates is calculated in decimal days according to the working schedule defined for your project. Variance displays the overall status of your project as days behind, days ahead, or on schedule. As dates change on your sheet, this updates automatically. Updating actual project dates triggers variance column recalculation.
Reset
Establish a new baseline start and end date. This resets the variances to zero and sets the values in the baseline columns to the current values in the actual start and end date columns. This creates a new snapshot of project dates, and the variance displays as on schedule.
Remove
Remove the baseline from your sheet. This removes the baselines but doesn't delete the Baseline Start, Baseline Finish, and Variance columns.
Track the critical path in a sheet
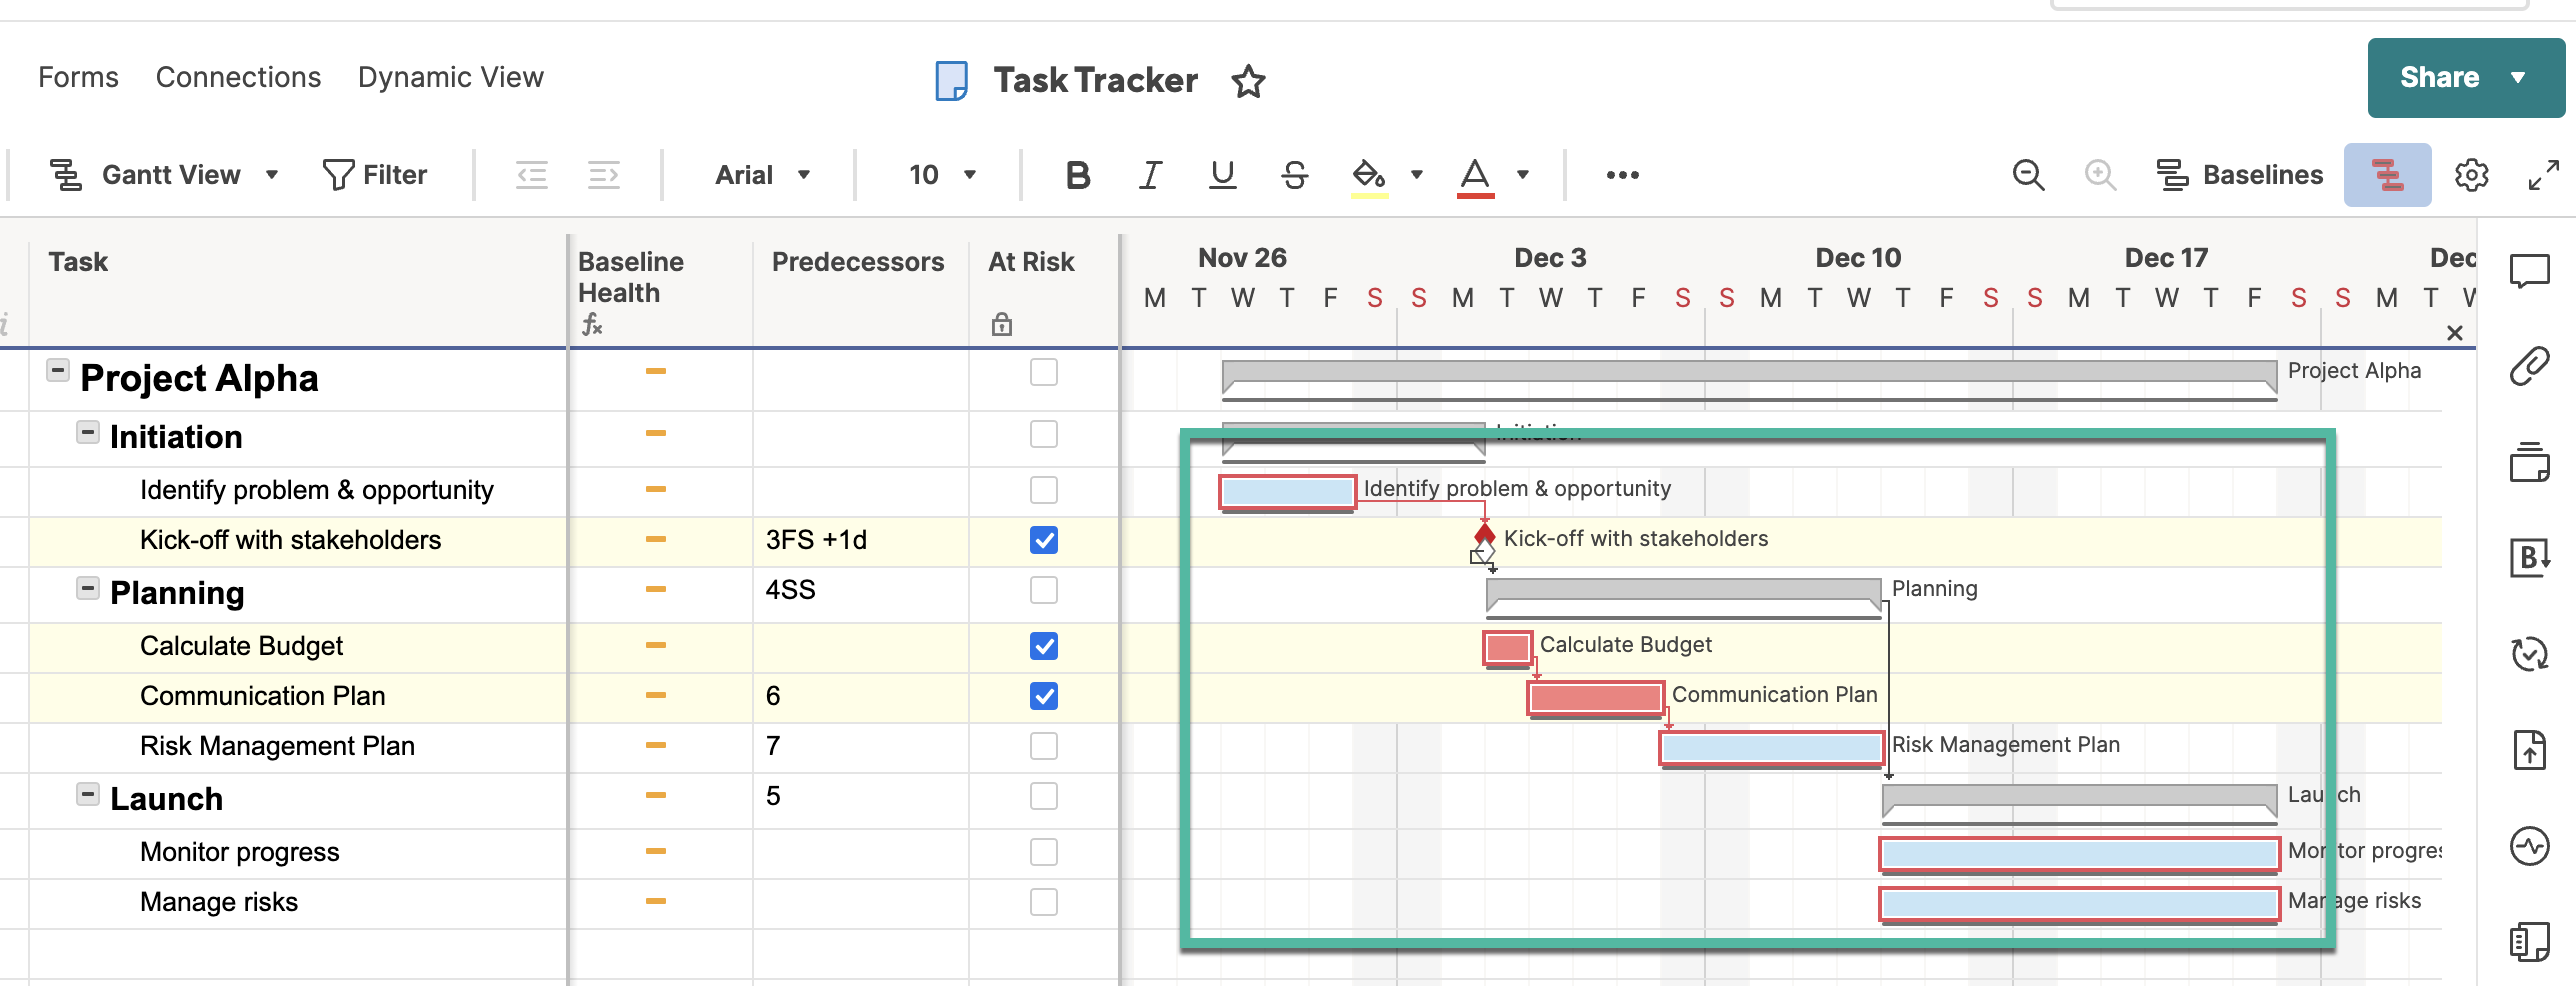
As task dates or predecessor relationships change, the sheet’s critical path can be impacted. Smartsheet automatically updates and highlights the tasks on the current critical path.
Only licensed users who are sheet Owners or Admins can enable dependencies in Project Settings to display the critical path. Anyone with Editor or higher-level permissions can display or hide the critical path.
What is the critical path?
The critical path is the longest sequence of tasks (from start to finish) that must be completed on time to stay on schedule and avoid project delays. It's determined using task start dates, end dates, duration, and dependencies.
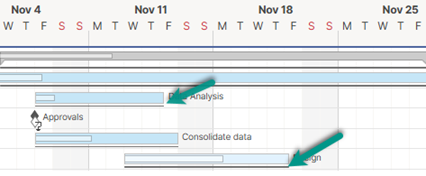
All tasks and milestones that make up a project's critical path appear highlighted in red in Gantt view.
Set up a sheet to display the critical path
To use a critical path, your sheet must be in Gantt view.
- Enable dependencies on the sheet by right-clicking any column header and selecting Edit Project Settings, or by going to the settings toolbar button at the top right corner of the Gantt view.
- Add tasks to your sheet, and ensure each has a start date, end date, duration, and predecessors.
- To activate the critical path, select the icon in the upper right corner of the sheet.
Brandfolder Image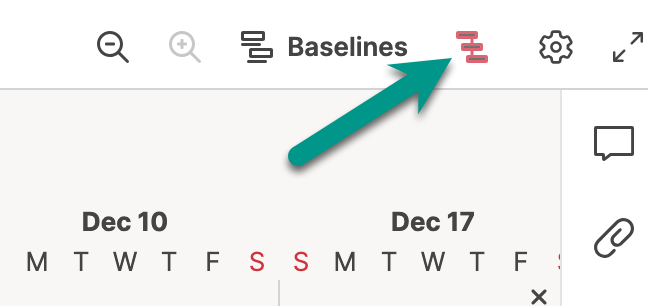
Tips and troubleshooting
- The critical path appears on child rows. To undo collapsed rows quickly, right-click on the primary column and select Expand All.
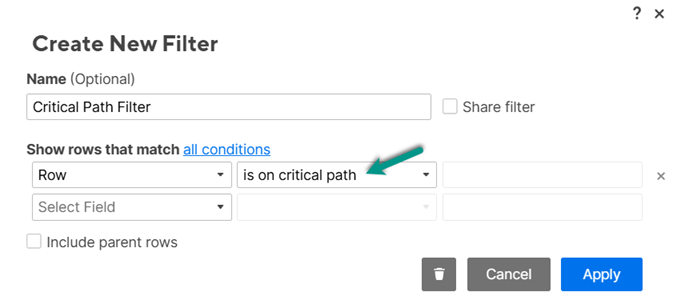
- You can apply a filter on your sheet to display tasks only in the critical path.
Brandfolder Image