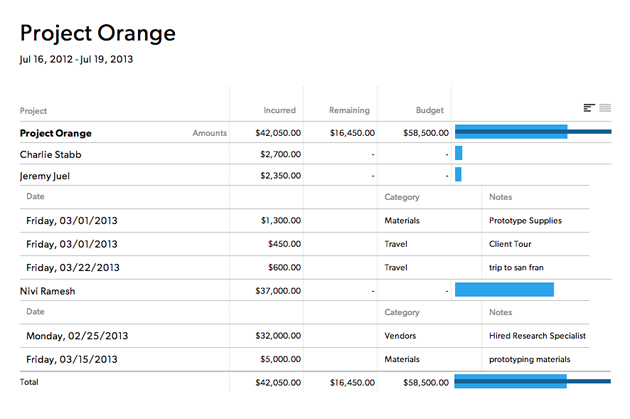
Expense reports show non-labor related project costs.
Expense reports can help your organization track various costs, such as those incurred when hiring outside vendors, ordering prototypes, or traveling.
Create an expense report
- Select Reports.
- Select New Report.
- On the right sidebar, select View, then Expenses.
Select Time Frame and the appropriate option
If you select a time frame relative to today, then the report is dynamic and will continue to show data with respect to the current date. If you want a set time range, select Custom Date Range.
- Set your first and second group by options if needed.
- Set any necessary filters.
- Select Run report.
The projects visible vary by permission level. For example, Project Editors can only see projects they own.

Expense report columns
| Column | Description |
|---|---|
Project Name | Select the project name to expand child rows and see more information about the project.
|
Incurred | Amount already expensed |
Remaining | Amount still available for project expenses |
Budget | Project expense budget. This number is set in project settings. |
Category | The category column appears when you select the project name to display more information. The expense category identifies the type of purchase, for example, travel. |
Notes | The notes column appears when you select the project name to display more information. Notes describe the expense. |
Chart | The chart shows graphically how much of the budget you have spent. |
Exporting the underlying report data to CSV includes the expense budget items. When you export a summary report CSV, the order of the columns could change, and any filters applied will show up in the CSV as well.
Example use for expense reports
Project budget expense report
- View: Expenses
- Time Frame: Custom Date Range
- First Group By: Project
- Then Group By: Team Member
- Show: Project: Project Name / Client: Project Client
Advanced reports
If your organization has a Business or Enterprise Smartsheet plan and uses Smartsheet authentication, then you can further analyze and share the data from your expense report in Smartsheet. When you create an advanced report from an expense report, multiple Smartsheet assets are created for you, including:
- Source sheet
- Expenses report
- Expenses report by category
- Dashboard
The expenses by category report shows project expenses grouped by expense category.
If a customer doesn’t have the resources to categorize their expense entries, this report can be modified or deleted. If it is deleted, the related dashboard should be updated to remove the related charts.
Learn more about the advanced report and the associated Smartsheet assets.